 |
Isothermal Titration Calorimetry (ITC) |
Brief Overview: Isothermal titration calorimetry (ITC) is used to measure interactions between ligands such as proteins and peptides, or proteins and other ligands (e.g. lipid heads groups).
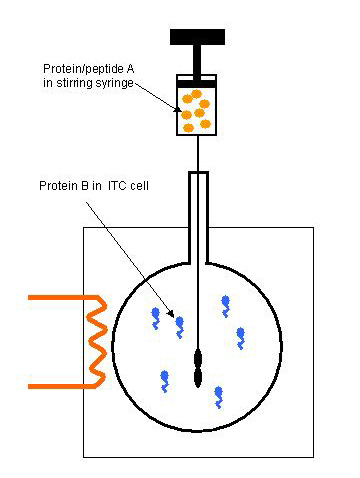
For ITC experiments, two binding partners (e.g., protein A and protein B, in the same buffer and at known concentrations) are placed in the injection syringe and the ITC cell. The ITC cell is kept at a tiny temperature difference compared to a reference cell filled with buffer.
 When protein B is injected, the two proteins interact. If this interaction is exothermic, the ITC uses less energy to heat the cell; if the interaction is endothermic, the ITC uses more energy to heat the cell. Precise measurement of the energy required to maintain temperature of the cell during the course of several injections leads to the calculation of free energy, enthalpy, entropy, Kd, and stoichiometry of binding from one single experiment. Furthermore the reaction can be measured without immobilization or labelling of the binding partners.
|
Tips and Tricks on how to set up an experiment
In order to obtain an optimal binding isotherm one needs to consider the following:
1. Relative concentrations of binding partners
The binding partner in the sample cell (1.6 ml volume for a VP-ITC) should be at least at a 10 fold higher concentration than the expected dissociation constant (Kd) of the reactants. Ideally it should be 30 fold higher. If the concentration is more than 100 fold above the dissociation constant the curve gets too steep and the fit is inaccurate. In this case the concentration should be lowered, if the signal is still be large enough. The ligand in the syringe should be titrated to a molar ratio of 4:1 compared to the binding partner in the sample cell. Since the total volume injected from the syringe is about 0.3 ml, the concentration of the ligand should be about 20 fold higher than the binding partner in the sample cell. The volume of the individual injections should be chosen such that the ligand and the binding partner reach a molar ratio of 1:1 after about 10-15 injections.
Example:
Dissociation constant 1 µM
Protein concentration in sample cell 30 µM
Ligand concentration in syringe 600 µM
Injection volume 6-8 ml
For a protein with a molecular mass of 50 kDa, 2.4 mg are needed for a single experiment and 1.8 mg of a ligand of 10 kDa (e.g. a small protein domain). The actual values are even higher since about 2 ml are needed to fill the sample cell and 0.6 ml for the syringe.
2. Signal to noise ratio
Although modern calorimeters have a fairly low thermal noise, it may sometimes be difficult to obtain reliable data, especially for weak interactions with a deltaH near zero. The value of deltaH alone does not tell much about the affinity. For the measurement exothermic and endothermic reactions are equally well suited. Small values of deltaH, however, can make the reaction unmeasurable although the binding might be tight if the reaction is purely driven by the entropy deltaS. In order to test whether a reaction is not happening or just not measurable, one can try to change the value of deltaH into either direction by changing:
a. the concentrations (the higher the better)
b. the temperature (since deltaH is temperature dependent)
c. the buffering system (since they have different heat of protonation which might be measurable)
In order to keep the noise low, one has to make sure that the buffer of the binding partner in the sample cell and of the ligand are as similar as possible. Otherwise there will be large peaks due to the mixing and dilution of the buffers, especially if they have a different pH. We found it useful to either dialyze or gel-filter both binding partners in the same buffer and also to keep some of that same buffer frozen for later repetitions. For ligands which may contain a high concentration of acid or base, such as lyophilized peptides from chemical synthesis, a high concentration of the buffering agent should be used to keep the pH constant when dissolving the ligand.
High noise in the experiment can also be caused by a bent injection syringe. Replacing the syringe is the best solution for this problem. Increasing noise during an experiment can be a sign of protein precipitation. This will become obvious when emptying the sample cell afterwards. Finally, air bubbles in the sample cell also cause a large amount of noise.
3. Stoichiometry and multiple sites
One of the powerful features of microcalorimetry is the fact that the stoichiometry (N) of binding can be determined directly and simultaneously. On the other hand any error in determining the concentration of the binding partner or the ligand becomes apparent after fitting traces as one expects the molar ratio of the reaction to be an integral multiple of 1. In case N deviates by more that 20 % of the expected value, one should carefully repeat the measurement of the concentration, ideally with an independent assay (Bradford, OD280, BCA,…). If both concentrations are correct, one can start to think about the fraction of active protein in the sample or about alternative binding models. If only 80 % of a protein are active and take part in the reaction, the concentrations can be adjusted before fitting the isotherm to the data. For 2:1 complexes it is advisable to have the binding partner with two binding sites in the sample cell. If the two ligands bind with different affinities, this will be much easier to recognize than in the opposite scenario where the N is 0.5:1. The fitting algorithms can be adjusted in either way (“Ligand in syringe” vs. “protein in syringe”) and will always give the correct values.
|
Example of the power of ITC measurements from our own work on the interactions of repeated peptide motifs, found in motif domains of endocytic proteins, which bind to the appendage domains of adaptor complexes:
|
Click on picture below for a Powerpoint tutorial given to students on the use of Calorimetry for measuring various ligand interactions in clathrin-mediated endocytosis |
|
| back to Techniques |
|